Vermillion, SD 2026 Housing Study
 📄 Print/PDF Version
Executive Summary
Vermillion is a growing, proactive university town in southeastern South Dakota. Over the past decade, Vermillion has grown at a rate of about 1.06% per year. The community is actively pursuing opportunities to grow its population, housing, and workforce through its Grow Vermillion plan, which targets 1.5% annual population growth, 1% annual labor force growth, and growing the housing stock by 20 or more single-family homes and 20 or more multi-family beds per year. The 2024 Grow Capital Campaign prioritized housing development and solutions, including:
Developing land to the east and north of Vermillion
Establishing another development like Bliss Pointe
Encouraging an over fifty-five residential community
Growing housing stock with a range of price options
Pursuing grant funding and managing funds
Utilizing existing reports to develop additional housing solutions
Vermillion has taken an active approach to growing the availability of housing in the community in recent years, permitting 149 rental housing units and 28 single-family owner-occupied homes across 2024 and 2025.
Vermillion is an in-demand community. Even as Vermillion has grown its housing supply, occupancy rates, especially for rental housing, have stayed high, indicating continued demand.
To meet this demand, Vermillion continues to pursue opportunities to deliver additional housing units, with plans for additional apartments targeting workforce housing needs and several projects to deliver housing specifically targeted toward seniors.
As Vermillion plans for the future, PorchLight was contracted to assess the upcoming housing needs of the community. To assist local leaders targeting the Grow Vermillion goals in decision making, this report prioritizes a 1.5% growth scenario in recommendations, while also providing key context based on historical trends and a 2% growth scenario where Vermillion overshoots its targeted growth.
To conduct this assessment, PorchLight analyzed existing data, conducted a visual inspection of housing structures in town, and collected input through interviews and a survey of USD students. This report analyzes the period from 2024-2034.
Based on our research and analysis, we recommend the following for Vermillion to have an appropriate amount of housing to accommodate its 1.5% annual growth target:
1. Build at least 555 new rental units by the end of 2034 to achieve 1.5% growth targets, targeting sustained 5-8% vacancy rates.
2. Build 436 owner-occupied housing units by the end of 2034 to achieve 1.5% growth targets.
3. Continue efforts to generate housing that meets the needs of seniors.
4. Prioritize affordability with initiatives focused on low- and middle-income households.
5. Continue proactive rental initiatives, strengthen code enforcement, and review and update codes.
6. Track and publicly report new building permits at the unit level.
7. Prioritize addressing workforce challenges in housing.
8. Improve the housing experience for international students.
Key Takeaways:
Population Trends: Over the previous ten years, Vermillion’s population grew at a rate of 1.06% per year, increasing from 10,686 in 2014 to 11,878 in 2024. Based on input interviews in the community, we expect the University of South Dakota to face some enrollment headwinds due to changes around the attraction and enrollment of international students and the “enrollment cliff” affecting universities across the country, which is due to a smaller overall cohort of graduating seniors and changing post-secondary education patterns. We anticipate slowed growth in the 15-24 age demographic. Assuming other demographic cohorts maintain typical demographic patterns, we would expect Vermillion to grow at a rate of 0.68% annually from 2024-2034. However, we also include scenarios for 1.5% and 2% growth in Vermillion to provide context for the Grow Vermillion goal of 1.5% annual population growth, as past demographic trends do not account for Vermillion’s active efforts to attract new residents and deliver the housing to accommodate them.
Workforce Housing Challenges: As Vermillion pursues population and business growth, non-academic employers in the community face some housing challenges around leasing cycles, home sales, and more. Leaning in to ensure appropriate year-round housing availability is critical to meet the needs of a broad variety of employers and employees in the community.
A Rental-Heavy Community: Vermillion has a high proportion of rental properties in the community, with 58% of households renting. The City of Vermillion is proactive in its approach to register, monitor, and regulate rental housing, which is critical for protecting residents and property in the community. Vermillion’s active approach to the rental market means it is well-positioned to address issues related to property maintenance for some rentals. Across all properties, PorchLight’s visual inspection revealed a portion of properties needing minor (330) or major (36) repairs (plus 8 dilapidated properties). Input interviews revealed concerns across the community about maintenance of rental properties, as many of the properties of concern are in high-traffic areas in the community and are thus front-of-mind for some residents. In particular, property issues like siding or roofing in disrepair threaten to shorten the lifespan of Vermillion’s housing stock.
Why 2024?
Of note, while this report was written in 2026, the modeling in this report covers the years 2024-2034. This is because the best and most granular source of housing data for rural communities, the American Community Survey, is not released in real time. At the time of the writing of this report, the most recent data available was for 2024, so we look at a ten-year period of 2024 to 2034. Some of the data in this report is more recent, including information from 2025, but the core modeling of the report is based on 2024 data, and we choose to project out 10 years from that data.
Read on through the rest of the report for our full recommendations, a detailed housing needs analysis, and an appendix full of data and additional analysis.
Table of Contents
Recommendations
Based on the analysis contained in this report, we recommend the following:
1. Build 555 new rental units by the end of 2034 to achieve 1.5% growth targets, targeting sustained 5-8% vacancy rates.
Based on the projected demand for rental housing in Vermillion, we project that at minimum Vermillion will need 337 additional rental housing units by 2034 (compared to 2024). That means Vermillion needs approximately 33 to 34 new rental units per year to meet base demand.
In 2024 and 2025, Vermillion permitted 207 beds totaling approximately 149 housing units, plus it has permitted 20 units in early 2026 on a previous commercial property, for a total of 169 planned units. That means Vermillion needs to permit at least 168 additional housing units by 2034 to meet expected demand.
Additionally, in late 2025 two tax-credit projects in Vermillion were announced.
The James Street Villas project will “construct 20 new units for seniors (55+) in Vermillion. There will be 18 two-bedroom units for tenants at or below 60% AMI. Two units will be market rate.”
Madison Park Townhomes Phase III “will construct 34 new units in Vermillion. There will be 14 two-bedroom units and 13 three-bedroom units for tenants at or below 60% AMI. Seven units will be at market rate.”
While these numbers describe a scenario for Vermillion to meet its basic rental housing needs, we expect there is significant latent demand for additional rental units in Vermillion for two reasons.
First, Vermillion has a very high occupancy rate in its rental units, and we heard frequent reports of people having difficulty finding units. Until Vermillion is able to sustain a 5-8% vacancy rate, there will be continued demand for new units.
Second, we expect some substitute demand for new units in Vermillion from existing single-family rental units. As high-quality, well-maintained rental units come on line, we expect renters to shift to those units and some of the existing single-family rental stock to convert to owner-occupied units.
Vermillion is actively pursuing growth to achieve its Grow Vermillion targets. As Vermillion seeks to target 1.5% annual growth, it will require 555 new rental units by 2034 (386 additional permitted units) to achieve those targets.
If Vermillion seeks to accommodate 2% annual growth, it will require 722 new rental units by 2034 (553 additional permitted units).
Vermillion’s greatest need for rental units is as follows:
Units that rent for $1,250-$2,500, targeting non-student households with household incomes above $75,000 but below $100,000.
Units that rent for less than $875 targeting non-student households with incomes below $35,000. These units are prime candidates to receive financing through the Low Income Tax Credit Program.
Units to accommodate the university student population.
Earlier this year, Vermillion’s vacancy rate for rental units was 2.56%. To ensure the proper availability of rental housing, Vermillion should target a vacancy rate of 5-8% across all rental units.
2. Build 436 owner-occupied housing units by the end of 2034 to achieve 1.5% growth targets.
Vermillion will require 436 new owner-occupied units by 2034 (408 additional permitted units), to supply the housing required to achieve 1.5% annual growth.
Since 2024, Vermillion has permitted 28 single-family attached or detached homes, which for these purposes we assume will be owner-occupied. That leaves an additional 408 owner-occupied units to be built by 2034. That means Vermillion needs to permit and have lots available for about 44 new owner-occupied houses per year to meet demand.
Based on the projected demand for owner-occupied housing in Vermillion using historical data, we project that Vermillion will need at least 252 additional owner-occupied units by 2034 (compared to 2024).
If Vermillion experiences 2% annual growth it will require 558 new owner-occupied units by 2034 (530 additional permitted units).
Vermillion’s greatest need for owner-occupied units is as follows:
Households making $100,000 to $149,999. At current interest rates, those households can afford homes priced at $325,000-$585,000. (About 255 units for 1.5% growth).
Households making more than $150,000. At current interest rates, those households will likely be looking for homes priced at $487,000 or above. (About 75 units for 1.5% growth)
Households making $50,000-$75,000. At current interest rates, those households can afford homes priced at $162,000-$292,000. (About 72 units for 1.5% growth)
Households making less than $50,000, who at current interest rates will need homes priced below $195,000. (About 34 units for 1.5% growth)
3. Continue efforts to generate housing that meets the needs of seniors.
Vermillion has been active in efforts to generate senior-specific housing. Continued effort to see these projects to completion and accommodate the housing needs of seniors will pay dividends for the whole community.
In a base scenario, we expect the number of Vermillion residents over 65 to increase by 317, the largest increase of any age cohort. As a portion of Vermillion’s population ages, ensuring they have housing to suit their needs should be a priority.
Right now, Vermillion does not have significant senior housing options, meaning that seniors must either remain in housing that is too large, has too much maintenance, and no longer meets their needs; leave the community to find suitable housing; or move into new housing that still does not meet their needs.
Additionally, if seniors are able to move into more age-appropriate housing, that opens up affordable housing stock more suited to families and prime-age workers that is more affordable than newly-built single-family housing.
In late 2025, Vermillion’s James Street Villas project was awarded a tax credit to construct 20 new units for seniors fifty-five and older. Additionally, a co-housing project meant to be attractive to seniors is in the planning stages.
Projects like these will help Vermillion retain seniors and open up prime housing stock for younger households.
4. Prioritize affordability with initiatives focused on low- and middle-income households.
Vermillion has been proactive in pursuing affordable housing options for its residents across owner-occupied and renter-occupied housing, including the Governor’s House program for owner-occupied homes and utilizing tax credit programs for rentals.
With rising construction costs and higher interest rates, new construction is expensive and the housing market will not naturally develop new housing affordable for many households in Vermillion.
Vermillion should continue to maximize its utilization of these programs to generate housing affordable to families and workers and maximize Vermillion’s potential to attract workers.
5. Continue proactive rental initiatives, strengthen code enforcement, and review and update codes.
Vermillion has a high proportion of rental units (58%) compared to the typical South Dakota community, largely due to the effects of the university.
For this reason, Vermillion has several excellent programs to manage the safety and provision of rental housing in Vermillion, including a regular survey of rental unit operators, required registration of all rental dwellings, and regular inspections of rental units. These programs allow Vermillion to monitor and proactively manage rental housing issues and should continue into the future.
PorchLight’s visual inspection of Vermillion revealed some homes in need of repair. Additionally, input interviews indicated that across the community, there is a feeling that a certain set of Vermillion’s homes, particularly rentals in highly trafficked areas, are poorly maintained. Maintenance of the existing housing stock is critical to ensure housing does not become dilapidated and protect affordability for decades to come.
While some will say that housing is difficult to maintain when occupied by transient college students, exterior features like siding and roofing, which PorchLight observed in disrepair, are the responsibility of the landlord to maintain, not tenants, and are essential for the long-term health of the housing unit.
With such a significant portion of Vermillion’s housing stock rented out, Vermillion should take a more active approach to code enforcement (both through updating city code and in enforcement actions) to preserve existing and affordable housing stock before it becomes blighted or uninhabitable.
Additionally, the City of Vermillion should regularly review and update its code to address measures that inhibit the affordability or availability of housing.
6. Track and publicly report new building permits at the unit level.
Vermillion and Clay County should update their building permit reporting processes to align with surrounding communities and available data sources.
Specifically, they should either adopt an online web portal where building permit applications can be accessed by the public or post on its website an Excel document or PDF listing the previous month’s building permits. This transparency will provide important information for the public about building activity in Vermillion and is standard practice across many peer communities.
The reporting should include the type of permit, address, permit status, and anticipated cost. Additionally, for multi-family buildings, the report should include the number of units, as opposed to just the number of anticipated beds, to help align building permit data with how the US Census reports data.
7. Prioritize addressing workforce challenges in housing.
As Vermillion seeks to expand employment opportunities in the community, there are a few challenges non-university employers face in Vermillion’s unique housing market.
In particular, most leases and home sales in the community run according to the academic calendar, with activity peaking around May. Achieving appropriate vacancy rates year-round should be a priority for Vermillion. Input interviews revealed that for some employers, lack of available housing in non-peak times has meant they lost out on employees. Especially for housing that is not meant to be targeted toward university students, offering leasing cycles outside the academic calendar is critical.
Additionally, multiple employers pointed to issues around access to short-term housing in Vermillion. Summer interns have been reassigned to different locations because of a lack of housing and other short-term employees have struggled to find appropriate housing. Students who live in the dorms but want to stay and work over the summer have expressed difficultly finding or securing housing options to employers.
Access to short-term rentals or sublets in Vermillion is minimal. Exploring solutions to ensure there is some short-term housing available, especially over the summer, would contribute to Vermillion’s economic dynamism and worker attraction efforts.
8. Improve the housing experience for international students.
Across a variety of interviews, housing for international students was identified as a pain point. In particular, we heard several stories of international students arriving in town without previously secured housing.
Stakeholders in the community are working to address this issue, and with collaboration a solution is possible. The university should collaborate with stakeholders in the community to smooth these arrivals with a robust solution.
The university has taken steps in recent years to provide temporary housing for international students when they first arrive, but pain points still exist and there is a broad desire for a more comprehensive solution.
International students are a valued part of the Vermillion community, and residents want to see them have a smooth entry into town without the stress of finding housing in an unfamiliar location after most housing is already filled for the academic year.
Housing Needs Analysis
To project future housing needs for Vermillion, PorchLight analyzed available data using our custom housing model built for rural communities and small towns.
The owner-occupied and rental analyses each include a summary of the modeling, a high-level look at the expected change in housing units required, and a summary table showing the net change in units required by 2034 compared to 2024.
Population Scenarios
Throughout this report, you will see a consistent color scheme to indicate diverging future paths for Vermillion.
Current Data
The most recent data available from the US Census’s American Community Survey is for 2024, and this historical data is shown in blue. This information involves no projections and comes from already existing data.
As of 2024, according to the American Community Survey, Vermillion’s population was 11,878.
Base Scenario
The base scenario, shown in green, is PorchLight’s projections based on current demographic trends and higher education enrollment headwinds. Interviews with the University of South Dakota identified challenges around the “enrollment cliff,” a national trend of lower college enrollment due to a lower total population of graduating high schoolers to draw from and changing trends in higher education enrollment. USD intends to pursue continued growing enrollment, but expects at least some years of little or slow growth.
As such, in the base scenario we model slower university student growth but assume the continuation of existing demographic and migratory trends for all other populations in Vermillion.
The base scenario is the standard scenario PorchLight would project Vermillion to experience, but these projections are not deterministic.
In the base scenario, Vermillion’s population in 2034 will be 12,709, an increase of 831 people, which equates to an annual growth rate of 0.68%. Over the previous 10 years, Vermillion grew at an average rate of 1.06% per year.
In this scenario, Vermillion’s prime working age adult population (ages 25-64) is projected to increase by 324 (4,207 to 4,531) or 0.74% annually.
1.5% Growth Scenario
The 1.5% growth scenario, shown in yellow, aligns Vermillion’s growth with the Grow Vermillion goal of 1.5% annual population growth. As Vermillion pursues new economic development opportunities and builds additional housing, intentional approaches may allow Vermillion to grow faster than the demographic trends of the previous decade and overcome university headwinds to reach a 1.5% annual growth scenario.
In the 1.5% growth scenario, Vermillion’s population in 2034 will be 13,786, an increase of 1,908 people, which equates to an annual growth rate of 1.5% exactly.
In this scenario, Vermillion’s prime working age adult population (ages 25-64) is projected to increase by 803 (4,207 to 5,010) or 1.76% annually.
2% Growth Scenario
The 2% growth scenario, shown in brown, models a scenario where Vermillion outpaces its Grow Vermillion goals.
In the 2% growth scenario, Vermillion’s population in 2034 will be 14,478, an increase of 2,600 people, which equates to an annual growth rate of 2% exactly.
In this scenario, Vermillion’s prime working age adult population (ages 25-64) is projected to increase by 1,114 (4,207 to 5,321) or 2.38% annually.
Owner-Occupied Housing
Calculating Demand
To estimate owner-occupied housing demand for 2034, PorchLight grouped current households by income, then adjusted for anticipated changes in age cohorts and income, and finally adjusted for ideal vacancy rates across the various growth scenarios considered in this report.
The above chart shows net demand for owner-occupied housing by each growth scenario to help illustrate the difference in owner-occupied housing needed for each scenario. Use the below table to see the total demand for owner-occupied housing at each household income level for each growth scenario.
For this table, total demand is the total number of households that will require housing in 2034, including current households, not the total number of new units that need to be built by 2034.
Calculating Supply
The yellow “Supply Model” chart shows the modeling PorchLight conducted to estimate supply for owner-occupied housing units in 2034. We first looked at the number of in-use housing units in 2024 and then adjusted for how many of those housing units are vacant and could re-enter the housing supply and how many units will be obsolete in 2034, based on the age of each unit and regional data for rural communities based on United States Department of Housing and Urban Development Components of Inventory Change (CINCH) data.
Evaluating Supply and Demand to Calculate Net Need by Household Income
Based on the above modeling, this table presents the net need for owner-occupied units to supply each income category.
In the base scenario, we project a need for 252 owner-occupied homes by 2034. For 1.5% growth, 436 owner-occupied homes, and for 2% growth 558 owner-occupied homes.
Unit Mix
For unit mix, we project that most of the owner-occupied demand in Vermillion will be for single-family homes, which includes duplexes and townhomes.
The largest need for owner-occupied units is for households making $100,000 to $149,999, with at least 132 additional owner-occupied units required by 2034. At current interest rates, those homes will be affordable at $325,000-$585,000. We expect demand in this range to be softened some by the 96 unit over-provision of units affordable to households making $75,000-$99,999, as households with incomes above $100,000 overlap with this range, hence why we suggest 132 instead of the 258 listed in the table. To achieve its Grow Vermillion goals, Vermillion will need 255 units in this category by 2034.
The next largest need for owner-occupied units is for households with incomes of $150,000 or more, with at least 45 additional units required by 2034. At 2026 interest rates, we expect these households to be looking for homes priced at $487,000 or above. To achieve its Grow Vermillion goals, Vermillion will need 75 units in this category by 2034.
We also expect the need for 37 additional owner-occupied units affordable for households making $50,000-$74,999. The price range for this group at current interest rates is $162,000-$292,000. These will likely be filled with townhomes or similar structures. To achieve its Grow Vermillion goals, Vermillion will need 72 units in this category by 2034.
Finally, we see a net need for at least seven owner-occupied units for households with incomes below $50,000, who need units that cost under $195,000 at current interest rates. These units will likely come in the form of manufactured housing. To achieve its Grow Vermillion goals, Vermillion will need 34 units in this category by 2034.

We consider a unit to be a single-family home if it does not share vertical space with another structure or housing unit. This category includes traditional detached single-family homes that exist separately from any other housing units, but it also includes attached single-family homes like a duplex or townhome. (ACS Technical Documentation)
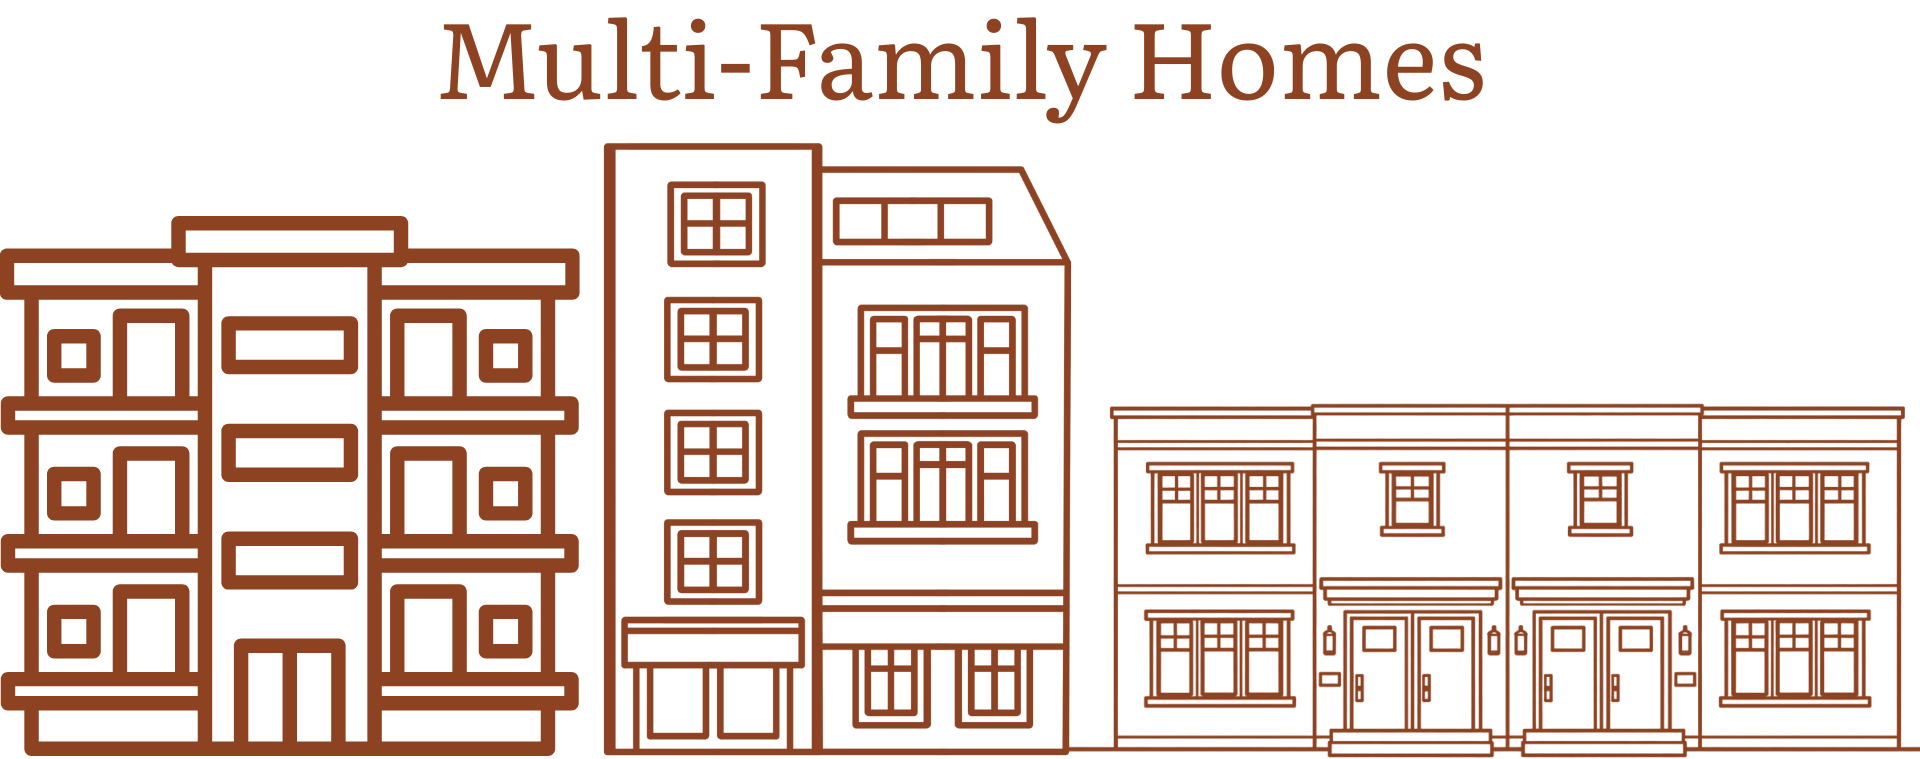
Multi-family units “are units in structures containing 2 or more housing units” where units share vertical space with other units. For example, this category could include a large or small apartment building, a four-plex with upstairs and downstairs units, or an apartment above a business. (ACS Technical Documentation)

Mobile homes are a nuanced piece of this housing mix analysis. Manufactured or mobile homes can provide a quick route to generating affordable housing, but can present challenges for a community around housing upkeep, utilities management, and storm resilience. For individuals, mobile homes can present as an opportunity to build home equity while in fact being a rapidly depreciating asset with potentially unaffordable maintenance and upkeep costs.
However, improvements in the quality of factory-built or prefabricated housing, especially when permanently installed on a more traditional lot, may present real affordable housing opportunities with limited downsides.
Initiatives like the Governor’s House program and modular housing help to achieve the affordability benefits of pre-fabricated homes with good quality materials and appropriate foundations and lots to serve as long-term, quality housing.
Calculating Owner-Occupied Housing Affordability
Changing interest rates and household-specific down payment amounts make the home prices required for specific incomes highly variable. Because the interest rate environment over the life of this report is variable, what is affordable for various incomes will change over the life of the report. For individuals building their own detached single-family homes, the owner-occupied market will take care of itself, as long as they can secure land and builders. However, for spec homes, townhomes, etc., builders will need to assess the financial environment and market as they prepare a specific project.
Use this calculator to get a sense of what these income bands translate to in terms of purchasing power.
Home Affordability Range Calculator
Rental Housing
To estimate rental housing demand for 2034, PorchLight separated out rental households under the age of 25 into its own category to isolate student housing, then grouped the remaining current households by income, adjusted for anticipated changes in age cohorts and income, and finally adjusted for ideal vacancy rates across the various growth scenarios considered in this report.
Calculating Demand
The above chart shows net demand for renter-occupied housing by each growth scenario to help illustrate the difference in renter-occupied housing needed for each scenario. Use the below table to see the total demand for renter-occupied housing at each household income level for each growth scenario.
In the table below, total demand is the total number of households that will require housing in 2034, including current households, not the total number of new units that need to be built by 2034.
Calculating Supply
This yellow chart shows the modeling PorchLight conducted to estimate supply for rental housing units in 2034. We first look at the number of in-use housing units in 2024 and then adjust for vacant units and how many of those housing units will be obsolete in 2034, based on the age of each unit and regional data for rural communities based on United States Department of Housing and Urban Development Components of Inventory Change (CINCH) data.
Evaluating Supply and Demand to Calculate Net Need by Household Income
Based on the above modeling, the following table presents the net need for units to supply each income category.
Vermillion is a rental-heavy market, with 58% of households renting. The largest need for rental housing is for units that rent for $1,250-$2,500/month, targeting households above the age of 25 with incomes of $75,000 to $100,000. This is likely premium rental housing in a nice apartment with amenities, townhome-style rentals, or traditional detached single-family homes.
The second highest need is for units that rent for less than $875 per month, targeting households above the age of 25 with incomes below $35,000. (See Income Limits and Program Eligibility.)
The third highest need is for rentals that serve the University of South Dakota’s student population. We chose to break this population out separately from the income-based affordability measures because students tend to show up as a household with less than $10,000 in income that pays way too much in rent considering their income, but being a student does not align with typical affordability measures. The mismatch between the number of units renting in the $580 to $1,250 range and the number of households in that range demonstrates one price point university students flock toward.
Vermillion sees significant demand for single-family and multi-family rental housing. However, we anticipate greater demand for new-built multi-family rental housing like apartments. Pursuit of single-family rentals should prioritize options like townhomes to target premium-price renters and maximize land utilization. Demand for detached single-family housing will likely be met through owner-occupied to renter-occupied conversions, as opposed to new-build detached single-family rentals.
See Owner-Occupied Housing for a description of how this report categorizes different types of housing.
Income Limits and Program Eligibility
The U.S. Department of Housing and Urban Development publishes annual income limits for Clay County that establish eligibility thresholds for virtually all federal and state housing assistance programs. For FY 2026, the Median Family Income (MFI) for Clay County is $105,100 (Department of Housing and Urban Development). Because Clay County is not part of a Metropolitan Statistical Area, HUD calculates its limits as a standalone non-metro area, applying adjustments for housing cost ratios and national income floors.
The following table presents the FY 2026 Section 8 Income Limits for Clay County, which govern eligibility for the HOME Investment Partnerships Program, the Housing Opportunity Fund, the Housing Trust Fund, and the Community Development Block Grant program.
A separate set of limits governs the Low-Income Housing Tax Credit program and tax-exempt bond financing. These Multifamily Tax Subsidy Projects (MTSP) income limits are calculated using a different hold-harmless methodology and may differ from the standard Section 8 figures. For FY 2026, the MTSP income limits for Clay County are as follows.
Implications for LIHTC Development
Under income averaging, a LIHTC project may designate individual units at income tiers ranging from 20% to 80% AMI, provided the average income restriction across all tax credit units does not exceed 60% AMI. This approach allows developers to serve a broader income mix within a single project, which can strengthen underwriting in markets like Vermillion where the rent differential between AMI tiers is relatively narrow.
Tax Credit Unit Recommendation
Our projections show a net need for at least 120 units affordable to non-student households with household incomes below $35,000. These households all fall below $42,040, which is the threshold for a household to be considered “Very Low Income” due to being at or below 40% of Clay County’s Median Family Income.
As such, we believe that if developers can make these units pencil, they would be very competitive applicants for the Low Income Housing Tax Credit program.
Appendix
A. Population Data and Trends
As of 2024, Vermillion’s population was 11,878, with a significant population aged 15-24 due to the University of South Dakota.
To understand current population patterns in Vermillion, PorchLight conducted a custom age-cohort analysis to identify typical inflows and outflows by age and model anticipated population growth. (See Methodology)
For Vermillion, the population bar chart above demonstrates the green base scenario, which models expected growth based on existing demographic and age-based trends, factoring in headwinds for university enrollment due to the national “enrollment cliff.”
We expect the 65+ age group to increase by 317 by 2034, the 25-44 age group to increase by 303, the 15-24 age group to increase by 217, the 45-64 age group to increase by 21, and the under 15 age group to decrease by 26. This results in a total population increase of 831.
We also chose to model population increases based on the Grow Vermillion goal of 1.5% growth per year and a 2% growth scenario, as well. Those projected population trends can be seen above.
A 1.5% annual growth scenario would result in a 2034 population of 13,786.
2% would lead to a population of 14,478.
B. Household Data and Trends
Because multiple people often live in one household, we also model population change at the household level, by age. Based on population projections, we project the number of housing units by householder age by modeling what percentage of each age cohort’s population are householders, and applying those ratios to the population projections.
Modeled here in the base scenario, we project an increase of 488 households from 2024-2034. We anticipate an increase of 188 households aged 65 and older, an increase of 179 households aged 25-44, an increase of 106 households under the age of 25, and an increase of 15 households aged 45-64.
We expect the largest variance in household growth to occur in the 25-44 year old age band, as this is the largest overall household cohort with the strongest in-migration patterns. We anticipate slower growth among university students and lower levels of household formation, as opposed to group quarters/dorm-style living.
C. Housing Tenure
In Vermillion, 1,812 housing units (42%) are owner-occupied and 2,500 housing units (58%) are renter-occupied. In US Census data, the term “tenure” is used to differentiate between households who own their home and households who rent.
Generally, households with higher incomes own more than they rent, but it is not a perfect correlation. The below chart shows owners versus renters by household income.
In Vermillion, the crossover point where more households own than rent is $100,000. The majority of households in Vermillion with a household income below $100,000 are renters and the majority of households in Vermillion with a household income above $100,000 own their home. Homeownership rates are closer to 50/50 among households with incomes between $50,000 and $99,999, but renting still exceeds homeownership in these income brackets.
In addition to owner and renter households, Vermillion has a significant group quarters population.
Analyzing data from the 2024 American Community Survey and the 2020 US Census (the most recently available group quarters data), 9,485 people live in households that own or rent in Vermillion (80%), 2,257 people live in group quarters like a university residence hall (19%), and the remaining 1% live in nursing facilities (80), “other noninstitutional facilities” (40) or adult correctional facilities (16).
University Housing Renovations
Vermillion will experience some increased pressure on the rental market from typical group quarters residents due to residence hall maintenance, but the short- and long-term impact of these renovations is more limited than some in the community might expect for a few key reasons.
First, renovations are already ongoing and have been absorbed by the existing housing market. While about 300 residence hall beds will be offline through 2034 or 2035, the University has only been releasing 100 students from on-campus living requirements due to enrollment trends.
Second, renovations are expected to conclude around the end of this report’s project window (2034), so we do not model this demand into the needs of the community for 2034 and beyond.
Instead, Vermillion would be wise to front-load efforts to meet ten-year rental housing needs to meet some of the immediate demand and then let the natural increase in demand rise over the ten-year period to fill those units as residence halls return to 100% capacity.
D. Housing Costs
i. Rental Households
The following chart compares the cumulative number of households at or above a particular income level (solid line) in Vermillion to the number of occupied units in Vermillion that are affordable at that income level (dashed line).
Any area marked in red indicates an area where the number of households at a particular income level exceed the number of occupied units affordable to that income, and the area marked in green indicates where the number of units affordable at that income level exceeds the number of households.
In general, areas marked in red indicate there are too few units available for a particular income and areas marked in green indicate there are more units than required for that particular income level.
Vermillion’s affordability data must be taken with a note of caution, as university students have a distorting effect on affordability data. Vermillion appears to have a very significant number of households with incomes below $10,000 annually and a very high rent burden. However, many of these households are in fact university students, who don’t have the same type of budget as a typical household. In the modeling and projections for this report, we break out university students by isolating householders under the age of 25, an imperfect but useful proxy for university students.
With that said, accounting for university students does not wipe out all affordability concerns for low-income renters in Vermillion. Affordability data and interviews in the community still demonstrate a clear need for rental housing affordable to households with incomes below $50,000.
ii. Owner-Occupied Households
The following chart compares the cumulative number of owner-occupied households at or above a particular income level (solid line) in Vermillion to the number of owner-occupied housing units in Vermillion that are affordable at that income level (dashed line).
Any area marked in red, none in this chart, indicates an area where the number of households at a particular income level exceed the number of occupied units affordable to that income, and the area marked in green indicates where the number of units affordable at that income level exceed the number of households.
In general, areas marked in red indicate there are too few units available for a particular income and areas marked in green indicate there are more units than required for that particular income level.
Vermillion has an appropriate distribution of owner-occupied housing for its population, but affordability challenges persist.
In Vermillion, households with a mortgage face affordability challenges across the income spectrum. Even for households with a household income of $75,000 or more, 14% of those with a mortgage (116 households) spend more than 30% of their income on housing and are cost-burdened. The majority of households with a mortgage and incomes between $50,000 and $74,000 are cost-burdened.
With that said, most owner-occupied households in Vermillion with incomes above $75,000 can afford their homes, paying less than 20% of their income on housing.
E. Income Data
The median household income in Vermillion is $50,456 and the mean income is $65,338.
The largest income group in Vermillion is households making less than $10,000 annually, but this is heavily skewed by the many households under the age of 25 making less than $10,000 (i.e. students).
This chart breaks out household income in Vermillion by age of householder.
F. Economic Analysis
i. Inflow/Outflow Analysis
Using commute data from the United States Census, PorchLight analyzed the commute patterns of Vermillion workers and residents.
In total, there are 2,885 workers who live outside of Vermillion but commute into the community for work. The US Census classifies these as “inflow” workers, and they comprise 58% of people who are employed in Vermillion.
The other 2,106 people (42%) who are employed in Vermillion live and work in Vermillion. The US Census classifies these as “internal” workers.
Additionally, there are 2,294 people who live in Vermillion but leave to another community for work, meaning that 52% of workers who live in Vermillion are employed outside the community. The US Census classifies these as “outflow” workers.
Net, 591 more people commute into Vermillion for work than commute out of the community for work.
The biggest draw industries in Vermillion are educational services, accommodation and food services, and public administration.
The industries where Vermillion sees the largest net outflow of workers are manufacturing, transportation and warehousing, and health care and social assistance.
After Vermillion (2,106), the top locations where Vermillion workers live are Sioux Falls (498), Yankton (126), Elk Point (70), and Brookings (51).
After Vermillion (2,106), the top locations where Vermillion residents work are Sioux Falls (614), Yankton (260), Sioux City (140), Brookings (64), and Elk Point (51).
An important note: employment in a location is not the same as a daily commute to that location. Someone may, for example, be employed at a Sioux Falls organization but work from home in Vermillion every day.
G. Vacancy Rates
According to the American Community Survey, in 2024, 390 housing units in Vermillion were vacant. 180 were available for rent, 72 were for sale, 58 were vacant for “seasonal, recreational, or occasional use,” and 80 were classified as “other vacant.”
This indicates an owner-occupied vacancy rate of 3.82% and a rental vacancy rate of 6.72%. However, more recent on-the-ground data paints a slightly different picture. In PorchLight’s visual inspection, 44 of 1,884 units inspected were for sale, which equates to a vacancy rate of 2.34%. Additionally, PorchLight’s analysis of Vermillion’s survey of property managers indicates only 2.56% of rental units were available in January of 2026.
Additionally, input interviews indicated that Vermillion’s housing market is highly seasonal, with significant movement around the end of the academic year but few houses for sale or available leases in any other times of year. This poses a barrier to attracting talent for some non-education employers in Vermillion.
Why Target 2% Owner-Occupied Vacancy?
A 2% vacancy rate for owner-occupied housing demonstrates some availability in the market without a significant number of vacant properties. The typical American homeowner spends about 13 years in their home, and up to 90 days on the market is considered an appropriate amount of time for a home to sell. Taking these factors into account, a home following a typical homeownership cycle will spend about 2% of time vacant. This indicates appropriate housing availability without long-term vacant housing.
Why Target 5-8% Rental Vacancy?
For renter-occupied units, we recommend a target vacancy rate of 5-8%. Rental units experience higher turnover and provide necessary slack in the housing market. A 5-8% vacancy rate indicates the average rental unit spends one month vacant every 12-20 months.
H. Sales and New Builds
According to data from the US Census Address Count Listing, Vermillion has added, on net, 117 housing units since 2020, an average of 23.4 housing units per year.
For a more detailed look at where Vermillion has seen increases and decreases in the number of housing units, the following map provides more detail.
According to the City of Vermillion’s 2026 Housing Permits Summary Report, from 2021-2025, 71 single-family housing units and 280 multi-family beds were permitted.
I. Housing Condition Inspection
On April 20-21, 2026, PorchLight conducted a visual inspection of attached and detached single-family dwelling units (single-family homes and townhomes) in Vermillion using a windshield survey.
Homes were evaluated according to the following rubric.
The results of the inspection can be viewed in this interactive map. Dots do not correlate to exact coordinates for each home. Click the information button to see the legend and color-coding system.
Overall, PorchLight reviewed 2,597 single-family dwelling units. 2,202 (84.8%) were in sound condition, 330 (12.7%) required minor repairs, 36 (1.4%) required major repairs, 8 were dilapidated (0.3%), and 21 (0.9%) were under construction, which includes homes in the process of significant repairs. 44 houses had “for sale” signs.
Areas with significant numbers of new builds were in good condition in Vermillion, but areas with older builds saw quite a few poorly maintained homes. In particular, based on input interviews and the visual inspection, quite a few of the homes that are not well maintained are rental homes.
J. Community Input Summary
PorchLight conducted input interviews with a variety of individuals to develop a qualitative understanding of the housing market in Vermillion alongside existing data. The following is a summary of those conversations, anonymized to allow individuals to speak freely. These conversations represent a variety of perspectives, and the views individuals express may be their perception and not factually accurate.
i. Rental Market
Participants reported the Vermillion rental market is heavily defined by high occupancy rates, high costs, and a rhythm dictated almost entirely by the university schedule.
The Academic Leasing Cycle. Because the rental market caters to students, “the landlords like their leases to run from June 1 to May 31.” This creates a bottleneck for anyone trying to secure housing outside of that exact window. One participant recounted their own frustrating experience: “I came here in April, and I struggled to find a place to live, because all the leases… renew kind of with the school year.” Employers face significant hurdles when relocating staff, noting that if a new hire arrives in March, “you might have like, zero to two options,” forcing professionals to settle for substandard, temporary housing or look to neighboring towns.
Pricing and Affordability Pressures. The student population has an impact on rental prices. Because landlords can lease properties “by the bedroom,” they can extract higher total rents from groups of students than from a single working family. As one participant pointed out, “for $2,000 you know, you can put four college kids in that… and $2,000 is more than a lot of people’s mortgages.” Another participant echoed this frustration, noting they saw “a 1,300 square foot house for $1,800 a month,” which is financially unsustainable for many local workers. This pricing structure handicaps local low-income voucher programs, as it is difficult to find rentals that fall below HUD’s strict payment standards.
Housing Quality and Maintenance. Rental conditions in the community vary significantly. On the positive side, participants report the recent construction of large apartment complexes has “raised the floor for all the single-family rentals” by introducing more competition. However, they also report a perception that older housing stock—particularly the single-family homes clustered around the center of town—suffers from neglect. Participants reported a variety of specific cases where home interiors or plumbing were sub-standard.
High Occupancy and Lack of Variety. The rental market operates at a very high occupancy rate. Even when new apartment buildings were constructed to provide relief, “they filled up immediately,” rapidly returning the city to near 100% capacity. Furthermore, participants noted a distinct lack of rental variety tailored to non-students. Young professionals moving to the area often struggle to find apartments where they aren’t forced to live next to the “party crowd” or share common spaces with undergraduate students. Housing is actively being built to accommodate this market, but as of the time of interviews these new units had not yet been felt in the market.
ii. Owner-Occupied Market
Extreme Competition with the Rental Market. One of the most defining characteristics of the Vermillion home-buying market is the constant competition with investors. Because of the university’s influence, single-family homes are highly sought after to be converted into rentals. One participant bluntly described their home search by saying, “Buying a house in Vermillion was a nightmare.” They explained that investors often scoop up properties “before they even hit the market” so they can “buy it and then turn it into a rental.” Another participant noted that in certain neighborhoods, “about half of it is rentals,” which severely limits the “opportunity to come in and find an affordable house.” Furthermore, a participant pointed out that when single-family homes become “landlord owned,” it creates significant challenges for the maintenance of the community’s existing housing stock.
Shifting Price Expectations and Affordability. Participants indicated that the definition of an affordable home has fundamentally changed, noting that “entry level housing is anywhere between $250,000 and $350,000,” leading one to conclude, “I don’t think anything in the $300,000s is expensive anymore.” This new pricing reality is incredibly difficult for young professionals and families. A new teacher might be “coming in at $50,000 and trying to pay off student loans,” making it intimidating to “dare try to buy a house.” Another younger resident noted that “the newest houses are $400,000 for 1,600 square feet,” concluding that “at least our generation, we can’t” afford those prices on our own.
Housing Quality and Lack of Variety. When lower-priced homes do become available, they often require extensive renovations. As one participant observed, channeling the viewpoint of first-time buyers, “I can afford the home, but I can’t afford all the fix ups.” Older historic homes in the center of town “are starting to get dilapidated,” meaning a buyer is “just going to pour a lot of money” into repairs. Meanwhile, participants noted a lack of variety in new builds, describing them as having “very much that new construction and very the same footprint” and feeling somewhat “cookie cutter.”
The “Downsizing” Bottleneck. A major factor constricting the supply of starter homes is that older residents have nowhere to go. Because the community lacks sufficient single-level townhomes or accessible senior apartments, “the people who live in the big old houses don’t have anywhere to go.” Another participant echoed this, noting that widowers are “sitting in a four bedroom house by themselves” because there are no smaller condominiums or maintenance-free options to transition into.
However, there are several active projects in the work that should help to address some demand for downsizing.
Property Taxes. Finally, some participants noted “property taxes are a huge hurdle for this whole community” when it comes to buying a home. One participant expressed concern about the amount of property owned by the state and the impact on total taxable value. Participants noted that this drives potential buyers to neighboring towns.
iii. Workforce Challenges
Participants described Vermillion’s workforce challenges as a significant barrier to business growth, driven by a shallow labor pool, unique town demographics, and a highly restrictive housing market. Employers across manufacturing, healthcare, education, and retail face a complex workforce environment shaped by the university’s dominant influence and seek expanding housing options for their employees.
Severe Shortages and Commuter Attrition. Some local businesses reported struggling to fill both skilled and entry-level roles. One manufacturer noted they are short on welders right now and that their “revenue growth is outpacing our capacity right now.” While covering standard turnover is manageable for some, expanding operations is difficult: “If we need to grow our number of employees, we are challenged.” Because these workers heavily desire single-family homes with garages to use as workshops, the lack of affordable starter homes pushes them to commute from neighboring towns. Some employers report their commuting employee base can be easily enticed to stay closer to home in, for example, Yankton, with a shift of just a few dollars, which could be mitigated with more workforce housing in Vermillion. Businesses can face “early attrition” when commuting workers inevitably find similar pay closer to home and decide to “cut out a 25 minute commute.”
Housing Bottlenecks for Recruitment. The local housing market obstructs hiring efforts for some employers. Because leases are heavily tied to the June-to-May student cycle, a professional “moving in for a new job in March” will struggle to find a place to live. Short-term housing for a three-month stay is reported to be nearly impossible to find in Vermillion. This lack of transitional housing means businesses sometimes lose young talent before they even start; for example, corporate interns often “can’t find a place, so they get reassigned” to facilities in other states. Similarly, college students who want to stay and work locally over the summer often “end up going home” because they cannot stay in the dorms past May and have nowhere to live.
Varying Impacts by Industry. The degree to which housing acts as a barrier depends heavily on the industry. In education and healthcare, the lack of housing rarely causes candidates to outright decline jobs, with one leader stating they have “never actually had someone say, ‘I’m not taking this job because there is no house.’” The school district also benefits from hiring former student teachers and noted that they don’t face the severe recruitment struggles seen in other small towns. However, professionals in these fields frequently have to “settle” for lower-quality construction or choose to commute from towns up to 40 miles away. Finding an affordable starter home is particularly intimidating for early-career nurses and new teachers who are trying to find housing and pay off student loans. Food service providers on campus reported zero housing-related recruitment issues since their workforce consists almost entirely of students living in the dorms.
The “Adult” Leadership Gap vs. The Student Labor Pool. Employers who rely heavily on entry-level shift work have an abundance of young, part-time applicants. However, retaining these young adults is difficult. Retail and corporate employers struggle to find candidates to groom for management, bluntly stating, “we just don’t have adults.” Young professionals often hesitate to stay because they feel there are limited social or dating opportunities in small towns. Healthcare employers echoed this, wishing they could tap into more non-student “local talent” for dependable, full-time roles like clinic registration, rather than constantly working around student schedules.
The “Trailing Spouse” Dilemma. When recruiting nationally for experienced leadership, medical, or engineering roles, employers frequently lose candidates due to a “lack of meaningful work for the other partner.” Because the university is the dominant employer and operates on strict annual hiring cycles, a trailing spouse who misses the hiring window might have to “wait eight months for some of these jobs to open.”
iv. Growth, Development, and Zoning
Varying Appetites for Growth. When discussing the ideal population trajectory, opinions ranged from cautious to highly ambitious. Some participants expressed a preference for “slow, steady growth,” emphasizing that they do not want a “big boom” so the community and local services have time to adjust. For example, the school district recently built a new elementary school with extra capacity and noted that reaching 1,400 students and maintaining “slow growth beyond that” would be ideal. Another participant said they would simply love to see an “extra 100 people a year.”
Conversely, others felt the city defaults to the “status quo” and isn’t pushing hard enough for expansion. These participants want to see the town reach “25,000 to 30,000 people,” even joking that they would be perfectly happy “pushing the limits of our sewer system.”
Direction of Expansion. There is a strong consensus that new housing construction must move “east and north.” Expanding westward is essentially “landlocked,” while moving south toward the river presents flooding concerns and the costly logistical challenge of pumping water and sewage up the bluff. As a result, the northeastern area and the South Dakota Highway 50 corridor were frequently cited as the most practical zones for future development.
Infrastructure. The single biggest barrier to new housing development is the upfront cost of extending roads, water, and sewer lines to new sites. Participants noted that local builders at this time do not have the capital to fund the extending of roads, water and sewer lines. While the city has the systemic water and wastewater capacity to support growth, local builders often find that “the capacity to build the infrastructure is more than what they can do” before they can even start building homes.
To overcome this, some participants pointed to Tax Increment Financing (TIF) as a vital tool, which is currently being considered as an option for a new co-housing project. However, it was noted that there is “a lot of resentment in this community about tax increment financing,” largely because the public doesn’t fully understand how it works or why the city uses it to spur growth.
Participants note that TIFs have been used in recent projects and leaders in the community work to educate residents on this financing option, but work needs to continue to educate residents.
Infill Lots and Regulatory Hurdles. Beyond expanding the city’s footprint, participants discussed opportunities to build on “infill” lots—empty spaces within the existing city limits, such as the site of a demolished school. However, movement on these lots is slow because “nobody wants to be the first” to build a spec house in an unproven area.
Additionally, strict city ordinances are viewed as a deterrent to new construction. Participants argued that loosening rules around “setbacks, road width, and accessory dwelling units” would greatly help development. Historic neighborhood requirements were also cited as overly burdensome; one participant claimed that forcing builders to match a historic aesthetic adds to the construction cost just to meet design mandates. For older residents looking to downsize into these neighborhoods, such mandates are a source of “sticker shock” for construction.
Accessory Dwelling Units (ADUs) and Occupancy Limits. Some participants expressed interest in loosening regulations for Accessory Dwelling Units (ADUs), with participants noting that many residents would love to “move their parents into a little casita in the back of the house.” However, the City’s focus on safety and the unique rental needs and pressures of the community have made non-traditional units less obvious for the community. Basement apartments are similarly challenging in informal settings, as Vermillion code requires “separate air” systems to be up to code.
Some participants expressed frustration with occupancy limits that restrict rentals to four unrelated individuals, “even if it had seven bedrooms.” This rule feels inconsistent to some, particularly because fraternity and sorority houses operate under a “different classification” and are not subject to the exact same per-bedroom limits.
The Safety Bottom Line. While some participants would like to see certain developmental codes loosened, other participants stressed that core safety codes cannot be compromised. Pointing to past legal challenges, it was emphasized that enforcing “hard wired smoke detectors, egress windows… and separate HVAC” is non-negotiable. Even if developers dislike installing features like fire sprinklers, participants noted these regulations are necessary, citing a recent fire where “four kids… are alive today” directly because of those strict hardware requirements.
In particular, Vermillion has a significant young, transient, and inexperienced rental population of college students that required strong protections in areas like safety and a more robust monitoring regime than other communities of a similar size. This environment leads Vermillion in the direction of formal apartment arrangements instead of informal or converted rental living.
v. Results of Survey of Current USD Students
To help understand a key target demographic for Vermillion, PorchLight coordinated with USD to survey current USD students about their interest in staying in Vermillion following graduation. Summarized here are the results of that survey.
Students shared a positive overall impression of Vermillion and many regard it as a special place. Some students reported difficulty finding housing in Vermillion. Most students shared they do not intend to remain in Vermillion following graduating, citing employment and family as the primary factors for why they do not plan to stay in the community. While some students expressed concern about finding housing if they chose to stay in Vermillion beyond graduation, most students did not identify housing as a primary factor in their decision-making in whether to stay.
K. Methodology Notes
i. Population Modeling
To analyze historical population change and project future population trends, this study employs an age-cohort analysis using data from the American Community Survey (ACS). Population estimates are organized into ten-year age cohorts, structured to align with life-stage transitions and long-term demographic movement.
Age cohorts are defined as follows: ages 0–4, 5–14, 15–24, 25–34, 35–44, and continuing in ten-year increments through age 85 and older. This structure allows for consistent tracking of population cohorts over time while accounting for births, aging, migration, and mortality.
For each community, population counts are extracted for the most recent ACS year available (currently 2023) and for the same geography ten years prior (2013). To measure cohort change, each age group in the earlier year is compared to the corresponding group ten years older in the later year. For example, the population aged 25–34 in 2013 is compared to the population aged 35–44 in 2023. This comparison approximates the same cohort aging forward through time, allowing the analysis to capture net population change attributable to in-migration, out-migration, and survival effects.
Percentage changes are calculated for each cohort over the ten-year period. These cohort-specific change rates are then applied forward to project population by age ten years into the future. In practice, this means that observed historical trends—such as gains or losses as residents move from early adulthood into mid-career years—are applied to today’s younger cohorts to estimate how those populations are likely to evolve over the next decade.
Special adjustments are made for the youngest and oldest age groups. For the 0–4 age cohort, projections are based on the historical relationship between total population and the share of residents represented by early childhood ages, reflecting expected birth rates rather than cohort aging. For the oldest age groups, upper-age categories (particularly ages 85 and older) are consolidated to adjust for the fact that all individuals aged 85 and older are reported as one category, so the 75 to 84 cohort and the 85 and older cohort combine over a ten-year period.
Based on information received during the input interviews and due to the unique nature of college students in Vermillion, we chose to take a different approach for the 15-24 demographic. Due to anticipated enrollment headwinds, we modeled population change for 15- to 24-year-olds as 50% of the growth among that cohort from 2014-2024, assuming growth may be flat in the early years of this report and reverts to the mean by the end of this report’s timeline.
For modeled growth scenarios in Vermillion, PorchLight adjusted the base scenario’s cohort change trends with an equivalent percentage point adjustment across all cohorts. For example, for a 1% adjustment, -18% becomes -17% and 25% becomes 26%.
ii. Tapestry-Based Housing Structure Preference Modeling
Our Tapestry-Based Housing Structure Preference Modeling estimates the likely demand for different housing structure types — single-family homes, multi-family units, and mobile homes — based on the demographic composition and housing tenure of the households in town. The methodology draws from the American Community Survey (ACS) Table B25125: Tenure by Age of Householder by Units in Structure, which provides a detailed cross-tabulation of housing occupancy by tenure, age of householder, and structure type.
The model begins with a breakdown of housing units in the community by owner-occupied versus renter-occupied tenure and by three age brackets: 15–34 years, 35–64 years, and 65 years and older. Within each segment, housing units are further categorized by structure type (e.g., single-family detached or attached, small multi-family buildings, large multi-family buildings, mobile homes, and other units).
To infer household preferences by demographic segment, the model typically compares the community’s current housing distribution to that of peer counties across South Dakota with similar Rural-Urban Continuum Codes (RUCC). These rural peer benchmarks are used to estimate the structure types typically occupied by households of similar age and tenure in comparable settings.
However, Vermillion’s housing tapestry is unique. We conducted research and found no peer or target communities that aligned with the specific housing needs and priorities of Vermillion, so we chose to essentially measure Vermillion against itself to determine likely future demand.
This comparative analysis yields an implied “tapestry” of preferred housing structures by demographic segment.
iii. Limitation of Census Data in Rural Communities
The United States Census American Community Survey (ACS) provides critical, granular data related to housing and population for rural communities. At the same time, this data is imperfect. Year-by-year data is based on sampling over a 5-year period, and margins of error are high in rural communities. Reproducing or finding this level of data would be nearly impossible without the American Community Survey, so its limitations are worth it for the data it can provide.
PorchLight works to collect additional data in the communities where we work, including through community interviews, to ensure this data aligns with the reality on the ground.
Acknowledgements
It has been a pleasure working with Vermillion on this housing study. Thank you in particular to our steering committee: Adam Chandler, Betty Smith, Jessi Hanson, Jim Peterson, John Prescott, Kate Fitzgerald, Laurence Brady, and Noah Westergaard. In addition, we are grateful to Damon Alvey, Kevin Kocer, Kirney Passick, Veronica Schmidt, Ericka Schapekahm, Alec Johnson, Dustin Sockness, Sodexo, Michelle Maloney, Jami Baedke and Hazen Bye for their insights. Thank you also to all of the survey respondents from USD and to USD for distributing the survey and sharing housing data.
About Us
PorchLight is the hub for rural workforce, partnering with rural communities to prepare for the 21st-century workforce. PorchLight is committed to connecting workforce to rural communities, and housing is a frequent barrier for communities to attract and retain workers. We love working with communities to solve problems and provide really good data. We pride ourselves on the connection we make with the people in the communities we serve and our ability to apply that essential people-centered information to augment the data and hard numbers we collect.
We believe that you should be able to work big and live small no matter where you choose to call home.
Berk Ehrmantraut - Director of Policy and Communities
Originally from Beresford, SD (pop. 2,180), Berk is the Director of Policy and Communities at PorchLight and the lead author on this report. He leads PorchLight’s work with communities to support their workforce needs including housing, childcare, community development, and employee attraction.
After growing up in Jamestown, ND and Aberdeen and Beresford, SD, Berk attended American University in Washington, DC, where he earned a Bachelor of Arts interdisciplinary studies degree in Communication, Legal Institutions, Economics, and Government. He is a Certified Collaborative Discussion Coach through the Collaborative Discussion Project.
After working on South Dakota political campaigns and working as a staffer for the South Dakota legislature, Berk returned to Washington, DC, where he served as the Senior Digital Communications Manager for Friends of the Global Fight Against AIDS, Tuberculosis and Malaria, an advocacy nonprofit responsible for securing $1.56 billion in annual appropriations for programs to fight infectious diseases globally.
Berk came back to South Dakota to serve as Executive Director of a major political non-profit. In his two years serving as Executive Director, he more than doubled election cycle expenditures, revitalized the organization’s culture, improved operational and financial procedures, delivered robust programming and events, and achieved key electoral objectives.
Berk lives in Sioux Falls, SD with his wife, Keeley.
Jessica Meyers - CEO
Originally from Winner, SD (pop. 2,852), Jessica Meyers was raised in Winner and Vermillion, SD, and earned her bachelor’s degree at South Dakota State University in Brookings. Jessica and her husband, Matt, followed the flight patterns of many young adults and left the small towns of SD for bigger cities. After 10 years of living in some of the largest cities in America, she now lives in Sioux Falls with her family. In her professional career, Jessica has worked in several industries, from publishing, sales, and healthcare recruiting, where she has run multi-million-dollar organizations and won multiple national awards across industries. Pairing over 20 years of sales and recruiting experience, she is co-founder and CEO of PorchLight. This talent recruitment firm partners with rural communities to prepare for the 21st-century workforce and connect rural workers to employment opportunities.
Jessica created the first-of-its-kind PorchLight Certification and the platform where rural development and job opportunities connect.
Jessica has been married for over 25 years to her high school sweetheart, Matt, and they have three daughters, Eve, Grace, and Juliet, who live in Sioux Falls, South Dakota.